Xray is a powerful and highly customizable tool that can be adapted to fit your needs. We have a vibrant testing community and user base that often surprises us with unexpected solutions and workarounds.
Simon Champenois is a QA Manager and member of the “Xray France User Club.” He created a unique workflow that allows Xray users to centralize test automation in Xray and Jira.
For Simon, this came from a need to centralize and manage test automation directly from the test management tool so that non-technical team members can also participate in test automation. At any moment non-technical team members need to be able to run automation to get feedback on certain aspects of the product.
Let’s take a look at his tutorial and learn how to centralize test automation and trigger automated tests directly from Jira and Xray.
Easily centralize test automation in Xray and Jira
Xray not only provides visibility of test automation results but it can also be customized to trigger automation right from Jira. This can be achieved with well-known apps, such as Automation for Jira, ScriptRunner, cPrime PowerApps, etc.
By having different automated tests alongside manual tests, all testing becomes centralized and accessible to everyone on the team.
Centralizing automated tests in Xray and Jira allows for non-technical people like project managers, business testers and business analysts to participate in test automation directly from Xray.
Proposed solution
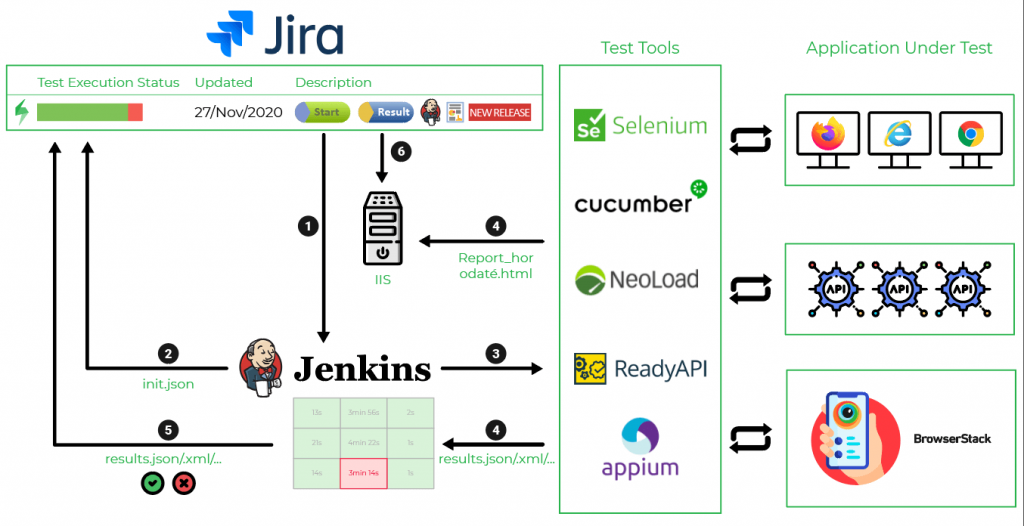
Simon's proposed solution works for Xray Server and DC. To begin, Simon highlights that since Xray uses Test Execution issues, we will use that as a base. The goal is to be able to link a Test Execution with a CI job that will be run in Jenkins. To achieve this, we use Xray built-in capabilities and make use of a link to the Jenkins job.
We will use a Jira dashboard with a standard Filter Results gadget to list Test Executions and provide shortcuts to trigger automation.
To do so, we'll implement some buttons in the "Description" field of the Test Execution: "START" and "RESULT."
The objective of this Jira Dashboard is to rely on existing test automations by adding a simple overlay to centralize all launches as well as their results.
This will provide you with:
- A single URL to access all automated tests
- A single view to display the results of API, UI, performance tests, etc.
- Jira is accessible to all and can be used without having technical skills
- Other information can be added and displayed (defects, manual tests, etc.)
Actions
- Access Jenkins Pipeline and trigger the build
- Initialize Test Execution and display the loading bar
- Start automation against test environment
- Import results and add buttons through Jira API
- Access the report
How to implement this solution
To display the buttons, all you have to do is add "images" as an attachment to "Test Execution" and associate them with a hyperlink. Depending on the stage of the test automation, these images will be displayed with their link via a request on the Jira API carrying the information to be “injected” on the “Description” field of the Test Execution.
To implement this solution, follow these steps:
1. Initialize the Jira Dashboard
- Create a new "Dashboard" on Jira and add the "Filter Results" gadget
- Add a filter on the "Test Execution" of the desired automated test (one TE per automated test)
- Add at least the "Test Execution Status" and "Description" columns
2. Initialize the Test Execution (TE)
- Have a Test Execution with the associated "Generic" type Xray tests identified by the automated test
- Add "fixed" information in the fields of the TE (environment, launch time, etc.)
- Add images you want on this TE: Start.png, etc
- Add hypertext links to the images in the "Description" field. This is to get the line to copy to the JSON file. For example for the image "Result"
3. Prepare JSON to inject via the Jira API
- Create the JSON files which will be injected according to the stage of the test automation by Jenkins. All file formats are detailed on the Xray Documentation.
- At the end of the automated test execution, the last JSON must contain the name of the report generated and its path on the IIS server. The automation modifies the JSON template or constitutes it with this specific hypertext link at runtime.
4. Configure sending JSON through API's
- It is possible to send these files by CURL commands however the easiest way is to go through Jenkins.
- Once a Test Execution has been configured with these 4 steps, it is sufficient to duplicate it for the other automated tests
Once set up, it is possible to adapt this Dashboard simply by modifying the data injected into the JSON file, for example.
- Add a link to the test execution videos
- Add a “New Release” icon if the automated test has been run on a new version
- Display the version of the tested application
- Display the automated test execution time
- Display the test tools icon (Selenium, ReadyAPI, etc.)
All of the information recorded by the automated test can be injected and displayed in Jira. It's up to you to create your own dashboard according to the needs of your projects.
This solution diverts the existing functionalities of Jira but makes it possible to meet the need of many projects to centralize their automated tests. You can use this solution and adapt it to the context of each project.
Centralize your automated tests for a single source of truth
Triggering your test automation directly from Xray and Jira allows non-technical people to take part in automated tests. This removes silos and allows all team members to contribute to quality and automation in a proactive way.